
Monday, July 25, 2011
Saturday, November 6, 2010
Brickyard Plantation Subdivision Median Sold Price Drops 12% from 2006 High

The median sold home price for Brickyard Plantation dropped 12% from a high in 2006 of $436,000 to $382,500 through October 2010.
Thursday, October 21, 2010
Home Sales and Prices Survive Tax Credit Fallout, Inventory Drops Near Annual Low

Sales Outpace 2009 Levels and Prices Continue Steady Growth.
CHARLESTON, SC—(October 11, 2010) 659 homes sold at a median price of $188,840 in September, according to preliminary data released by the Charleston Trident Association of REALTORS®. This reflects a 5% decline in sales but a 9% increase in median prices when compared to preliminary figures from September 2009.
Year-to-date figures show sales levels 15% ahead of this point last year, with the median prices increasing a slight 2%, holding ground in the high $180’s. Thus far in 2010, 6,698 homes have sold at a median price of $188,000. Compared to the same period last year, 5,829 homes sold at a median price of $185,000.
“At this time last year, the tax credit was in full swing, so it’s encouraging to see steady improvement in our sales and prices when compared against last year’s numbers” said 2010 CTAR President, Jeremy Willits.
“Despite the fact that some regions across the country are still experiencing significant declines in buyer activity, that is simply not the case for Charleston. We experienced a month of slow sales following the expiration of the tax credit, but heading toward the close of this year, we’ve established stability—sales have kept pace, median prices continue to show slow but steady growth rise and inventory is declining” said Willits.
The number of homes listed as actively for sale with the Charleston Trident Multiple Listing Service (MLS) was 9,312 at the end of September, down 4% from September 2009 and the lowest level of inventory this year seen since the beginning of this year. Inventory has had remained close to the 10,000 mark for much of the year, so declining inventory could signal a shift back toward more balanced between supply and demand.
BERKELEY COUNTY
Sales in Berkeley County hit a three-month high, with 172 sales at a median price of $168,948—a marked difference improvement from last September’s 135 sales at a median price of $150,000. September’s figures reflect a 27% increase in sales volume and a 13% increase in prices.
These increases are supported by significant levels of activity on Daniel Island—where sales are consistently doubling from 2009 levels. Sales of single family homes on the island have increased 109% year-to-date, without sacrificing prices—which remain steady in the $500,000 range.
CHARLESTON COUNTY
Sales in Charleston County were comparable with 2009 levels, while prices inched up another 5%. 351 homes changed hands at a median price of $224,500. In September 2009, 359 homes sold at a median price of $214,000.
Continued activity in the island markets support the steadying market—both Folly Beach and Isle of Palms, which was recently included on the Forbes List of America’s Most Expensive Zip Codes, doubled their sales over September 2009.
DORCHESTER COUNTY
Dorchester County showed improvement in median sale price last month—recording a 14% increase as prices climbed to$176,000. Last September, the median sale price was $154,000. Sales are still sluggish in the foreclosure-plagued county, with 120 sales in September 2010, down 27% when compared to September 2009’s 164 closings.
Most of the County’s activity is taking place in the Summerville/Ridgeville area, where 49 of the area’s 120 sales closed and prices increased 9% compared to last September. Notably, the North Charleston/Summerville/Ladson area recorded a 32% increase in median price during the month, jumping from last year’s $162,750 to $214,900.
AUGUST 2010 ADJUSTMENT
Preliminary numbers reported for August 2010 indicated 681 homes sold at a median price of $199,055. Adjusted numbers now show 697 sales at the same median price.
Written by: Meghan Byrnes Weinreich, Marketing and Communications Director Charleston Trident Association of REALTORS®
Saturday, October 16, 2010
Mount Pleasant continues to be a Hot area for Homes Sales
Mount Pleasant out performs last year home sales through September with 1153 sold compared to 944 in 2009 (up 18%). The average home sales price dropped slightly from $382,488 to $372,832 (-2.5%). On average through September there is a 13 mounth supply of homes on the Mount Pleasant market for 2010.
 Click on Chart to Enlarge
 Click on Chart to Enlarge
Thursday, October 7, 2010
The Greater Charleston Home Sales Market Starts to Weaken

Third Quarter 2010 results show a weakening of the Greater Charleston MLS home sales market. After a solid 10 month growth spree we are heading into negative growth compared to the previous 3rd quarter results. The decline is probably attributed to the discontinuation of the Government first time buyer tax credit. This may be a good time for buyers and investors as prices start to decline in the last quarter of 2010.
Wednesday, October 7, 2009
October may be the turning point for Charleston Tri-County home sales.


September and October show first signs of a turning point for home sales in the greater Charleston, SC area. For months the Tri-County area has seen negative monthly growth when compared to the same month in the previous year. In November of 2008 the home sales were -45% below November of 2007. The market has shown significant growth from a low of -45% to high of +15.5%in October. I expect November and December to also show positive growth.
The Government has added a real estate stimulus by extending the $8,000 Tax Credit for qualified first time buyers to April 2010. The new legislation has added a new Tax Credit for current home owners up to $6,500. Click here to see the new incentives
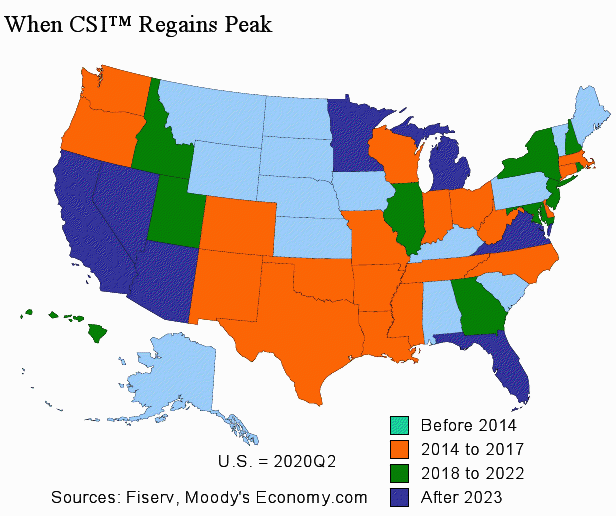
Paul Kedrosky reports a recent study by Moody’s (of all folks) that looks at that precise question: When will collapsed U.S. real estate prices regain their prior peaks? Paul reports that SC will return to its peak 2005 sales levels prior to 2014 while other states may take beyond 2023.
Tuesday, June 2, 2009
Bringing the Dream of Homeownership Within Reach

As part of its plan to stimulate the U.S. housing market and address the economic challenges facing our nation, Congress has passed legislation that grants a tax credit of up to $8,000 to first-time home buyers.
Here is more information about how the 2009 First-Time Home Buyer Tax Credit can help prospective home buyers become part of the American dream.
Breaking news: Tax Credit Can Be Used on Closing Costs.
Who Qualifies? First-time home buyers who purchase homes between January 1, 2009 and December 1, 2009.
To qualify as a “first-time home buyer” the purchaser or his/her spouse may not have owned a residence during the three years prior to the purchase.
Which Properties Are Eligible? The 2009 First-Time Home Buyer Tax Credit may be applied to primary residences, including: single-family homes, condos, townhomes, and co-ops.
How Much Will the Credit Be? The maximum allowable credit for home buyers is $8,000. Each home buyer’s tax credit is determined by two factors:
The price of the home—the credit is equal to 10% of the purchase price of the home, up to $8,000.
The buyer's income—single buyers with incomes up to $75,000 and married couples with incomes up to $150,000—may receive the maximum tax credit.
If the Buyer(s)’ Income Exceeds These Limits, Can He/She Still Get a Credit?
Yes, some buyers may still be eligible for the credit.
The credit decreases for buyers who earn between $75,000 and $95,000 for single buyers and between $150,000 and $170,000 for home buyers filing jointly. The amount of the tax credit decreases as his/her income approaches the maximum limit. Home buyers earning more than the maximum qualifying income—over $95,000 for singles and over $170,000 for couples are not eligible for the credit.
Will the Tax Credit Need to Be Repaid? No. The buyer does not need to repay the tax credit, if he/she occupies the home for three years or more. However, if the property is sold during the three-year period, the credit will be recouped on the sale.
Copyright 2009 © NATIONAL ASSOCIATION OF REALTORS® |
Monday, May 18, 2009
Summerville offers History, Beauty and a Wonderful Life-style.
This study looks at single family detached home statistics from 2000 to 2009 YTD 5-18-09. Visit the link below to learn more about the amazing town of Summerville.
 "The town's name is evocative of its history. Situated on a pine-forested ridge, it was first inhabited in the late 1700's as Charlestonians and other inhabitants of the SC Lowcountry sought respite from the summer heat, mosquitos and disease. From May to September plantation families along the nearby Ashley River and other coastal areas, headed for higher elevation to live temporarily or "maroon," in the tiny forest colony soon dubbed Summerville. Other pioneer residents descended from those 1696 puritans who settled the nearby former colonial settlement of Dorchester, endowing Summerville with a heritage spanning three centuries."

"Summerville's beauty is mirrored in her motto, "The Flower Town in the Pines." Since the early 1900's day tourists have flocked to the town during early spring to enjoy millions of spring blossoms, particularly azaleas, in private and public gardens, including the mid-town Azalea Park. It's no wonder perhaps that the motto on the town's official seal is Sacra Pinus Esto- The Pine is Sacred."
In 2000 Summerville sold 1200 single family detached homes and by 2005 reached 3200 homes per year. The number of homes sold averaged 28.4% growth per year from 2002 to 2005. The sales dollar volume grew from $161.3 million to a high of $700 million in 2006. The average home sold for $209,567 in 2006 with a median sales price of $194,170 and on average sold for 99.7% of the listing price. During that year homes averaged 46 days on the market (DOM) and there was a 3.5 months supply of homes in inventory at the end of 2006.
In 2007 the Summerville homes sold declined by -23% from the previous year to 2472 homes. In 2008 the home sales dropped -32.5% to 1668 homes sold. This sharp decline in home sales resulted in only a -4% average sold price and -5% median sales price in 2008.
The average and median sale price decline from 2008 to 2009 YTD (5/18/09) averaged -13.7% and -14% respectively to $176,926 average and $169,098 median price. There were 381 homes sold in 2009 through May 18th which will probably remain below the 2008 levels. The homes have sold on average 96.94% of the list price.
The decline in Summerville single family detached home is similar to the greater Charleston area. The average and median sales price have remained strong compared to other areas across the country. Summerville is a highly desirable place to live offering a rich history, wonderful life style and exceptional value to buyers moving into the area.
The slides below show the development of the Summerville single family detached home market. I hope this information is helpful to agents and their clients.
Figure 1: Monthly Home Sales
Figure 2: Yearly Home Sales
Figure 3: List, Average and Median Price
Figure 4: Sold Price as % of List Price


 "The town's name is evocative of its history. Situated on a pine-forested ridge, it was first inhabited in the late 1700's as Charlestonians and other inhabitants of the SC Lowcountry sought respite from the summer heat, mosquitos and disease. From May to September plantation families along the nearby Ashley River and other coastal areas, headed for higher elevation to live temporarily or "maroon," in the tiny forest colony soon dubbed Summerville. Other pioneer residents descended from those 1696 puritans who settled the nearby former colonial settlement of Dorchester, endowing Summerville with a heritage spanning three centuries."
"Summerville's beauty is mirrored in her motto, "The Flower Town in the Pines." Since the early 1900's day tourists have flocked to the town during early spring to enjoy millions of spring blossoms, particularly azaleas, in private and public gardens, including the mid-town Azalea Park. It's no wonder perhaps that the motto on the town's official seal is Sacra Pinus Esto- The Pine is Sacred."
In 2000 Summerville sold 1200 single family detached homes and by 2005 reached 3200 homes per year. The number of homes sold averaged 28.4% growth per year from 2002 to 2005. The sales dollar volume grew from $161.3 million to a high of $700 million in 2006. The average home sold for $209,567 in 2006 with a median sales price of $194,170 and on average sold for 99.7% of the listing price. During that year homes averaged 46 days on the market (DOM) and there was a 3.5 months supply of homes in inventory at the end of 2006.
In 2007 the Summerville homes sold declined by -23% from the previous year to 2472 homes. In 2008 the home sales dropped -32.5% to 1668 homes sold. This sharp decline in home sales resulted in only a -4% average sold price and -5% median sales price in 2008.
The average and median sale price decline from 2008 to 2009 YTD (5/18/09) averaged -13.7% and -14% respectively to $176,926 average and $169,098 median price. There were 381 homes sold in 2009 through May 18th which will probably remain below the 2008 levels. The homes have sold on average 96.94% of the list price.
The decline in Summerville single family detached home is similar to the greater Charleston area. The average and median sales price have remained strong compared to other areas across the country. Summerville is a highly desirable place to live offering a rich history, wonderful life style and exceptional value to buyers moving into the area.
The slides below show the development of the Summerville single family detached home market. I hope this information is helpful to agents and their clients.
Figure 1: Monthly Home Sales

Figure 2: Yearly Home Sales

Figure 3: List, Average and Median Price

Figure 4: Sold Price as % of List Price


Friday, April 24, 2009
Park West Subdivision 1st QT Home Sales Up 15 % for Single Family Detached Homes
Park West is one of the most prolific subdivisions for home sales over the past 10 years. It offers buyers a wide variety of styles and prices. The amenities are outstanding. Homeowners can find almost everything they need within a few miles of their home.

Mount Pleasant Map shows Park West Access from Hwy 17N and Hwy 41
10 Year History Single Family Detached Homes Sales Park West
 Park West homes sales were first reported by CTAR MLS in 1999 with 11 homes. Over a 10 year period (1999-2008) single family detached home sales in Park West have averaged 131 units per year. The highest year home sales was 228 in 2005. In 2009 YTD through March there have been 26 homes sold.
Figure 1: Homes Sales The first quarter single family home sales in Park West increased 15.4% from the first quarter of 2008.There were 26 homes sold in the first quarter 2009 compared to 22 in 2008.
Figure 2: Sales Volume The Park West sales volume at $9,735,651 was $436,349 below 2008 1ST QT or -4.5%. The decrease in volume dollars was attributed to decreased home prices as seen in Figure 3 below.
Figure 3: List, Avg. Sales and Median Sold Price Average sales price dropped $85,779 (-22.3%) from $470,474 in 2008 to $384,695 in 2009 1ST QT. The median sold price at $328,750 was down $44,417 (-13.5%).
Figure 4: Price / Sq. Ft. The average price $/Square Foot from $165 to $146 from 2008 to 2009. This was a $19.00 drop (-12.8%).
Figure 5: % Sold Price of List Price Homes in 2009 sold for 94.5% of the list price which was up +1.7% from 2008. This is partially attributed to the drop -24.4% in average list price during the same period.
Figure 6: Average Days on Market It took less days to sell a home in 2009 at 126 compared to 136 in the first quarter of 2008.
Figure 7: Current Inventory of Homes For Sale The home inventory decreased from 136 in 2008 to 123 in 2009 1st QT.
Figure 8: Months Supply of Inventory at Current Sales At the end of the first quarter 2009 there was 16 months of inventory which was down from 20 months in 2008.
In summary the Park West subdivision in Mount Pleasant (Charleston County) sold 15% more homes in the first quarter of 2009. The total sales volume was down due to a drop in the average and median sales price. In 2009 the average days on market was less and the supply of homes for sale decreased by 11% and the months supply of inventory was reduced by 24.5%.
Overall the real estate market is adjusting and sellers have lowered their average listing prices. The 15% increase in homes sold is significant in the current economy. The second quarter will show if we are at a turning point. Park West is a good area to study because it offers 131 homes sold per year on average in all price ranges and styles. From small starter homes to water front properties 3000+ square feet.

Mount Pleasant Map shows Park West Access from Hwy 17N and Hwy 41

10 Year History Single Family Detached Homes Sales Park West
 Park West homes sales were first reported by CTAR MLS in 1999 with 11 homes. Over a 10 year period (1999-2008) single family detached home sales in Park West have averaged 131 units per year. The highest year home sales was 228 in 2005. In 2009 YTD through March there have been 26 homes sold.
Figure 1: Homes Sales
 The first quarter single family home sales in Park West increased 15.4% from the first quarter of 2008.There were 26 homes sold in the first quarter 2009 compared to 22 in 2008.
 Figure 2: Sales Volume
 The Park West sales volume at $9,735,651 was $436,349 below 2008 1ST QT or -4.5%. The decrease in volume dollars was attributed to decreased home prices as seen in Figure 3 below.
Figure 3: List, Avg. Sales and Median Sold Price
 Average sales price dropped $85,779 (-22.3%) from $470,474 in 2008 to $384,695 in 2009 1ST QT. The median sold price at $328,750 was down $44,417 (-13.5%).
Figure 4: Price / Sq. Ft.
 The average price $/Square Foot from $165 to $146 from 2008 to 2009. This was a $19.00 drop (-12.8%).
Figure 5: % Sold Price of List Price
 Homes in 2009 sold for 94.5% of the list price which was up +1.7% from 2008. This is partially attributed to the drop -24.4% in average list price during the same period.
 Figure 6: Average Days on Market
 It took less days to sell a home in 2009 at 126 compared to 136 in the first quarter of 2008.
 Figure 7: Current Inventory of Homes For Sale
 The home inventory decreased from 136 in 2008 to 123 in 2009 1st QT.
Figure 8: Months Supply of Inventory at Current Sales
 At the end of the first quarter 2009 there was 16 months of inventory which was down from 20 months in 2008.
In summary the Park West subdivision in Mount Pleasant (Charleston County) sold 15% more homes in the first quarter of 2009. The total sales volume was down due to a drop in the average and median sales price. In 2009 the average days on market was less and the supply of homes for sale decreased by 11% and the months supply of inventory was reduced by 24.5%.
Overall the real estate market is adjusting and sellers have lowered their average listing prices. The 15% increase in homes sold is significant in the current economy. The second quarter will show if we are at a turning point. Park West is a good area to study because it offers 131 homes sold per year on average in all price ranges and styles. From small starter homes to water front properties 3000+ square feet.
Tuesday, April 21, 2009
Tri-County Area's Most and Least Expensive Median Priced Homes for Sale
The Charleston tri-county area consists of 3 counties with 32 areas. The red chart below lists the various areas. The first 3 letters after the area number represents the county. There are other areas listed in the MLS but they are outside the tri-county area. The map below shows the 3 counties Charleston, Berkeley and Dorchester.


Figure 1: Most homes sold by MLS area (YTD 4/21/09) Mount Pleasant (Area 42) has the most homes for sale at 1435 followed by Summerville (Area 63) 1083 homes.
Figure 2: Most Expensive Median List Price Homes by MLS area (YTD 4/21/09) Sullivan's Island (Area 43) is known for its very expensive homes on the southeast coast. With a median listing price of $1,750,000. Sullivan's Island was $400,000 higher than Dewees Island (Area 46) and $750,000 higher than Isle of Palms (Area 44).
Figure 3: Least expensive median list price homes by MLS area (YTD 4/21/09) North Charleston's (Area 31) and Rural Berkeley County (Area 75) offers the least expensive homes in the tri-county area. Both areas had a median list price of $115,000.


Figure 1: Most homes sold by MLS area (YTD 4/21/09)
 Mount Pleasant (Area 42) has the most homes for sale at 1435 followed by Summerville (Area 63) 1083 homes.
 Figure 2: Most Expensive Median List Price Homes by MLS area (YTD 4/21/09)
 Sullivan's Island (Area 43) is known for its very expensive homes on the southeast coast. With a median listing price of $1,750,000. Sullivan's Island was $400,000 higher than Dewees Island (Area 46) and $750,000 higher than Isle of Palms (Area 44).
 Figure 3: Least expensive median list price homes by MLS area (YTD 4/21/09)
 North Charleston's (Area 31) and Rural Berkeley County (Area 75) offers the least expensive homes in the tri-county area. Both areas had a median list price of $115,000.
Monday, April 20, 2009
Top 10 Price Ranges for Charleston Tri-County Area Homes
The CTAR MLS data confirms that over 80% of the homes sold in the Tri-County this year to date are under $300,000. The most popular range is $160,000 - $170,000 followed by $200,000 - $220,000. If your client has a home in these price ranges they should sell with in 104 days on average.
Figure 1: Top 10 price ranges for Charleston Tri-County area homes
Figure 1: Top 10 price ranges for Charleston Tri-County area homes

Friday, April 17, 2009
Tri-County Area Condo and Townhouse Sales Down in First Quarter 2009
 Single family attached home (condos and townhouses) sales in the first quarter were down -22.4% from the 1st QT of 2008 485 to 256 homes sold. Charleston County led with 167 homes sold followed by Berkeley 50 and Dorchester Counties 39 respectively. Overall the homes sold were down -75% from 1st QT 2005 to 2009 or 1023 to 256.
 In summary the tri-county single family attached(condos and townhouses)homes had the following changes from the 1st QT 2008 to 1st QT 2009: Sales volume was $69,537,710 down -51.6, the average sales price was $271,364 down -40.9, median sold was $167,102 down -16.4%, home sold for 94.6% of the list price down -2.3%, the inventory of attached homes was 2,915 down -12.4% and the months inventory of available homes increased by +550%.
Charleston County led the tri-county area with 19 homes sold in Mount Peasant's Park West subdivision on Grey Marsh Rd, Bagley Dr, Basildon Rd, Queensgate Way, and Claremont St. The Crain Crossing subdivision in Charleston was the second largest with 16 townhouses sold on Benninington Dr.
Monday, April 6, 2009
2009 1st Quarter Home Sales Slowest Start in 10 Years! Is the Bottom Near?
The Charleston area CTAR MLS reported the lowest first quarter home sales in the past 10 years. Homes sales in the 1QT-1998 were 1516 units while 1QT-2009 had 1376. The best first quarter during the past 10 years was 3990 in 2006. The decline between 2006 first quarter and 2009 was -65.5%.
While homes sales dropped -38.8% from 1QT-2008 to 1QT-2009, the reduction in Median sold price was only -11.2% during the same period. The Median sold price increased by 2.5% between first quarters from 2005 and 2009.
The question that everyone is asking is when the market will reach the bottom. There have been some positive indications in recent weeks. CNN reported this week that the a few economists were predicting the economy to bottom within 3 months. Moody’s Economy.com predicts the housing market will bottom out by year end. Other good news from the Mortgage Bankers Association said its seasonally adjusted index of mortgage applications, which includes both purchase and refinance loans, for the week ended April 3 increased 4.7% to 1,250.6.
Let's take a look at the first quarter 2009 for the Charleston area market.
Figure 1: 10-Year Monthly Home Sales The past decade had a 4 year period of stability, 4 years of rapid growth and 3 years of accelerated decline. 2009 first quarter home sales dropped to a 10 year low. First quarter home sales fell below the 1516 units reported in 1998 to 1376 in 2009.
Figure 2: 5-Year Homes Sales Quarterly Over the past five years the first quarter of each year had the lowest home sales followed by the second quarters highest units sold. The 2009 second quarter growth will be an indicator of weather the bottom is in sight.
Figure 3: Comparison 1St Qt Home Sales 2005-2009 Home sales fell from 3869 to 1376 (-64%) between 1st Qt 2005 to 1st Qt 2009.
Figure 4: 5-Year Volume Sales per Quarter
 Volume sales dropped from $978,652,565 in first quarter 2005 to $354,941,995 first quarter of 2009.
Figure 5: Comparison 1St Qt Volume Sales 2005-2009
 Volume sales dropped -47.6% between first quarter of 2008 and 2009.
Figure 6: 5-Year Average List, Average Sold and Median Price List price, average sold price and median sold price all declined in the first quarters of 2008 and 2009.
Figure 7: Comparison 1St Qt 2005-2009 Average List, Sold and Median Prices
 From the first quarter 2008 to 2009 the list price dropped -12.7%, average sale price dropped -14.4% and the median price declined -11.5%.
Figure 8: Comparison 1St Qt 2005-2009 average sales price as a percent of list price The percent sold to list price declined in the first quarters of 2008 and 2009 by 0.7% and -2% respectively. The decrease between 2005 and 2009 was -4.3% from .982 to .939.
Figure 9:1QT Days on Market Comparision 2005-2009 First Quarter days on market reached 118 in 2009.
Figure 10: Comparison 1St Qt 2005-2009 Current Inventory
 For the last 8 quarters there has been an inventory of between 11,000-12,000 homes.
Figure 11: Comparison 1St Qt 2005-2009 Months Inventory In the first quarter 2009 there was a 24 month home inventory.
In summary the first quarter of 2009 reported the worst start in 10 years, the volume was $354,941,995 down -47%, averages sold price dropped -14.7% to $257,531, the sold to listing ratio dropped -2%to 93.9%, days on the market reached 118 up from 104 in 2008, the current inventory is around 11,000 units and there is a 24 month supply of homes at the current demand.
Overall it is the best buyers market in the last decade offering interest rates below 5% for 30 year fixed mortgages, tax incentives for first time buyers, low average sale and median sold prices, high inventory of new construction, an abundance of foreclosures in all price ranges, and 11,000 sellers motivated to sell their homes.
There have been some positive signs in the housing market recently but I think the housing market will not bottom out until the first quarter of 2010.
While homes sales dropped -38.8% from 1QT-2008 to 1QT-2009, the reduction in Median sold price was only -11.2% during the same period. The Median sold price increased by 2.5% between first quarters from 2005 and 2009.
The question that everyone is asking is when the market will reach the bottom. There have been some positive indications in recent weeks. CNN reported this week that the a few economists were predicting the economy to bottom within 3 months. Moody’s Economy.com predicts the housing market will bottom out by year end. Other good news from the Mortgage Bankers Association said its seasonally adjusted index of mortgage applications, which includes both purchase and refinance loans, for the week ended April 3 increased 4.7% to 1,250.6.
Let's take a look at the first quarter 2009 for the Charleston area market.
Figure 1: 10-Year Monthly Home Sales
 The past decade had a 4 year period of stability, 4 years of rapid growth and 3 years of accelerated decline. 2009 first quarter home sales dropped to a 10 year low. First quarter home sales fell below the 1516 units reported in 1998 to 1376 in 2009.
 Figure 2: 5-Year Homes Sales Quarterly
 Over the past five years the first quarter of each year had the lowest home sales followed by the second quarters highest units sold. The 2009 second quarter growth will be an indicator of weather the bottom is in sight.
 Figure 3: Comparison 1St Qt Home Sales 2005-2009
 Home sales fell from 3869 to 1376 (-64%) between 1st Qt 2005 to 1st Qt 2009.
Figure 4: 5-Year Volume Sales per Quarter
 Volume sales dropped from $978,652,565 in first quarter 2005 to $354,941,995 first quarter of 2009.
 Figure 5: Comparison 1St Qt Volume Sales 2005-2009
 Volume sales dropped -47.6% between first quarter of 2008 and 2009.
Figure 6: 5-Year Average List, Average Sold and Median Price
 List price, average sold price and median sold price all declined in the first quarters of 2008 and 2009.
Figure 7: Comparison 1St Qt 2005-2009 Average List, Sold and Median Prices
 From the first quarter 2008 to 2009 the list price dropped -12.7%, average sale price dropped -14.4% and the median price declined -11.5%.
 Figure 8: Comparison 1St Qt 2005-2009 average sales price as a percent of list price
 The percent sold to list price declined in the first quarters of 2008 and 2009 by 0.7% and -2% respectively. The decrease between 2005 and 2009 was -4.3% from .982 to .939.
Figure 9:1QT Days on Market Comparision 2005-2009
 First Quarter days on market reached 118 in 2009.
Figure 10: Comparison 1St Qt 2005-2009 Current Inventory
 For the last 8 quarters there has been an inventory of between 11,000-12,000 homes.
Figure 11: Comparison 1St Qt 2005-2009 Months Inventory
 In the first quarter 2009 there was a 24 month home inventory.
In summary the first quarter of 2009 reported the worst start in 10 years, the volume was $354,941,995 down -47%, averages sold price dropped -14.7% to $257,531, the sold to listing ratio dropped -2%to 93.9%, days on the market reached 118 up from 104 in 2008, the current inventory is around 11,000 units and there is a 24 month supply of homes at the current demand.
Overall it is the best buyers market in the last decade offering interest rates below 5% for 30 year fixed mortgages, tax incentives for first time buyers, low average sale and median sold prices, high inventory of new construction, an abundance of foreclosures in all price ranges, and 11,000 sellers motivated to sell their homes.
There have been some positive signs in the housing market recently but I think the housing market will not bottom out until the first quarter of 2010.
Wednesday, April 1, 2009
Charleston Tri-County Percent Growth
In my previous posting Charleston Tri-County Area Real Estate Market Analysis, I looked at the tri-county from strickly numbers view. It showed that on average Charleston County had the most units sold, largest sales volume, biggest inventory and highest priced home. The last posting did not address the fastest developing counties in the Charleston tri-county area. Let's now take a look at the Growth of the counties over the past 10 years. Since the numbers are much larger for Charleston county, I indexed the figures to 1998 = 100.
(For example in figure 12: below in 1998 Berkeley County sold 1,348 units. If 1,348 = 100% and in 1999 the units increased to 1,686 or 125%. This means that the units had a growth of 25% from 1989 to 1999. In Charleston County 4,805=100% units were sold in 1998 and 4,578 in 1999. This resulted in a decrease to 95% or 5% decline from 1998 to 1999.)
Figure 12: Charleston Tri-County Unit Sales Growth
 Charleston County has the most units sales with 51% in 2008 but Berkeley County had the strongest growth in unit sales in the tri-county area over the past 10 years followed by Dorchester and Charleston counties.
Figure 13: Charleston Tri-County Sales Volume Growth

Berkeley County led the tri-county volume dollar growth with a high in 2006 of 628% growth from 1998-2006 (6.28 times the 1998 figure). In 2008 Berkeley County lead with an accumulative growth of 349% compared to Dorchester County 221% and Charleston County 188% respectively for 1998-2008.
Figure 14: Charleston Tri-County Average Sales Growth

Charleston and Berkeley had an accumulative average sales dollar growth of 203% from 1998-2008. Dorchester grew 168% during the same period.
Figure 15: Charleston Tri-County Unit Inventory Growth

Charleston County had the largest unit inventory growth at 413%. The Charleston County Inventory grew from 144% to 411% from 2005-2007. Dorchester County had a more gradual unit inventory increase 286%.
Figure 16: Charleston Tri-County Months Inventory Growth

Charleston County had 18.5 months of inventory at the end of 2008 and led the tri-county area with a growth of 448% from 1998-2008.
It is clear from the study that the tri-county area offers a home that will fit any buyer or sellers needs.
Subscribe to:
Posts (Atom)